Time from under offer to exchange: The Prime London housing market
30 August 2022
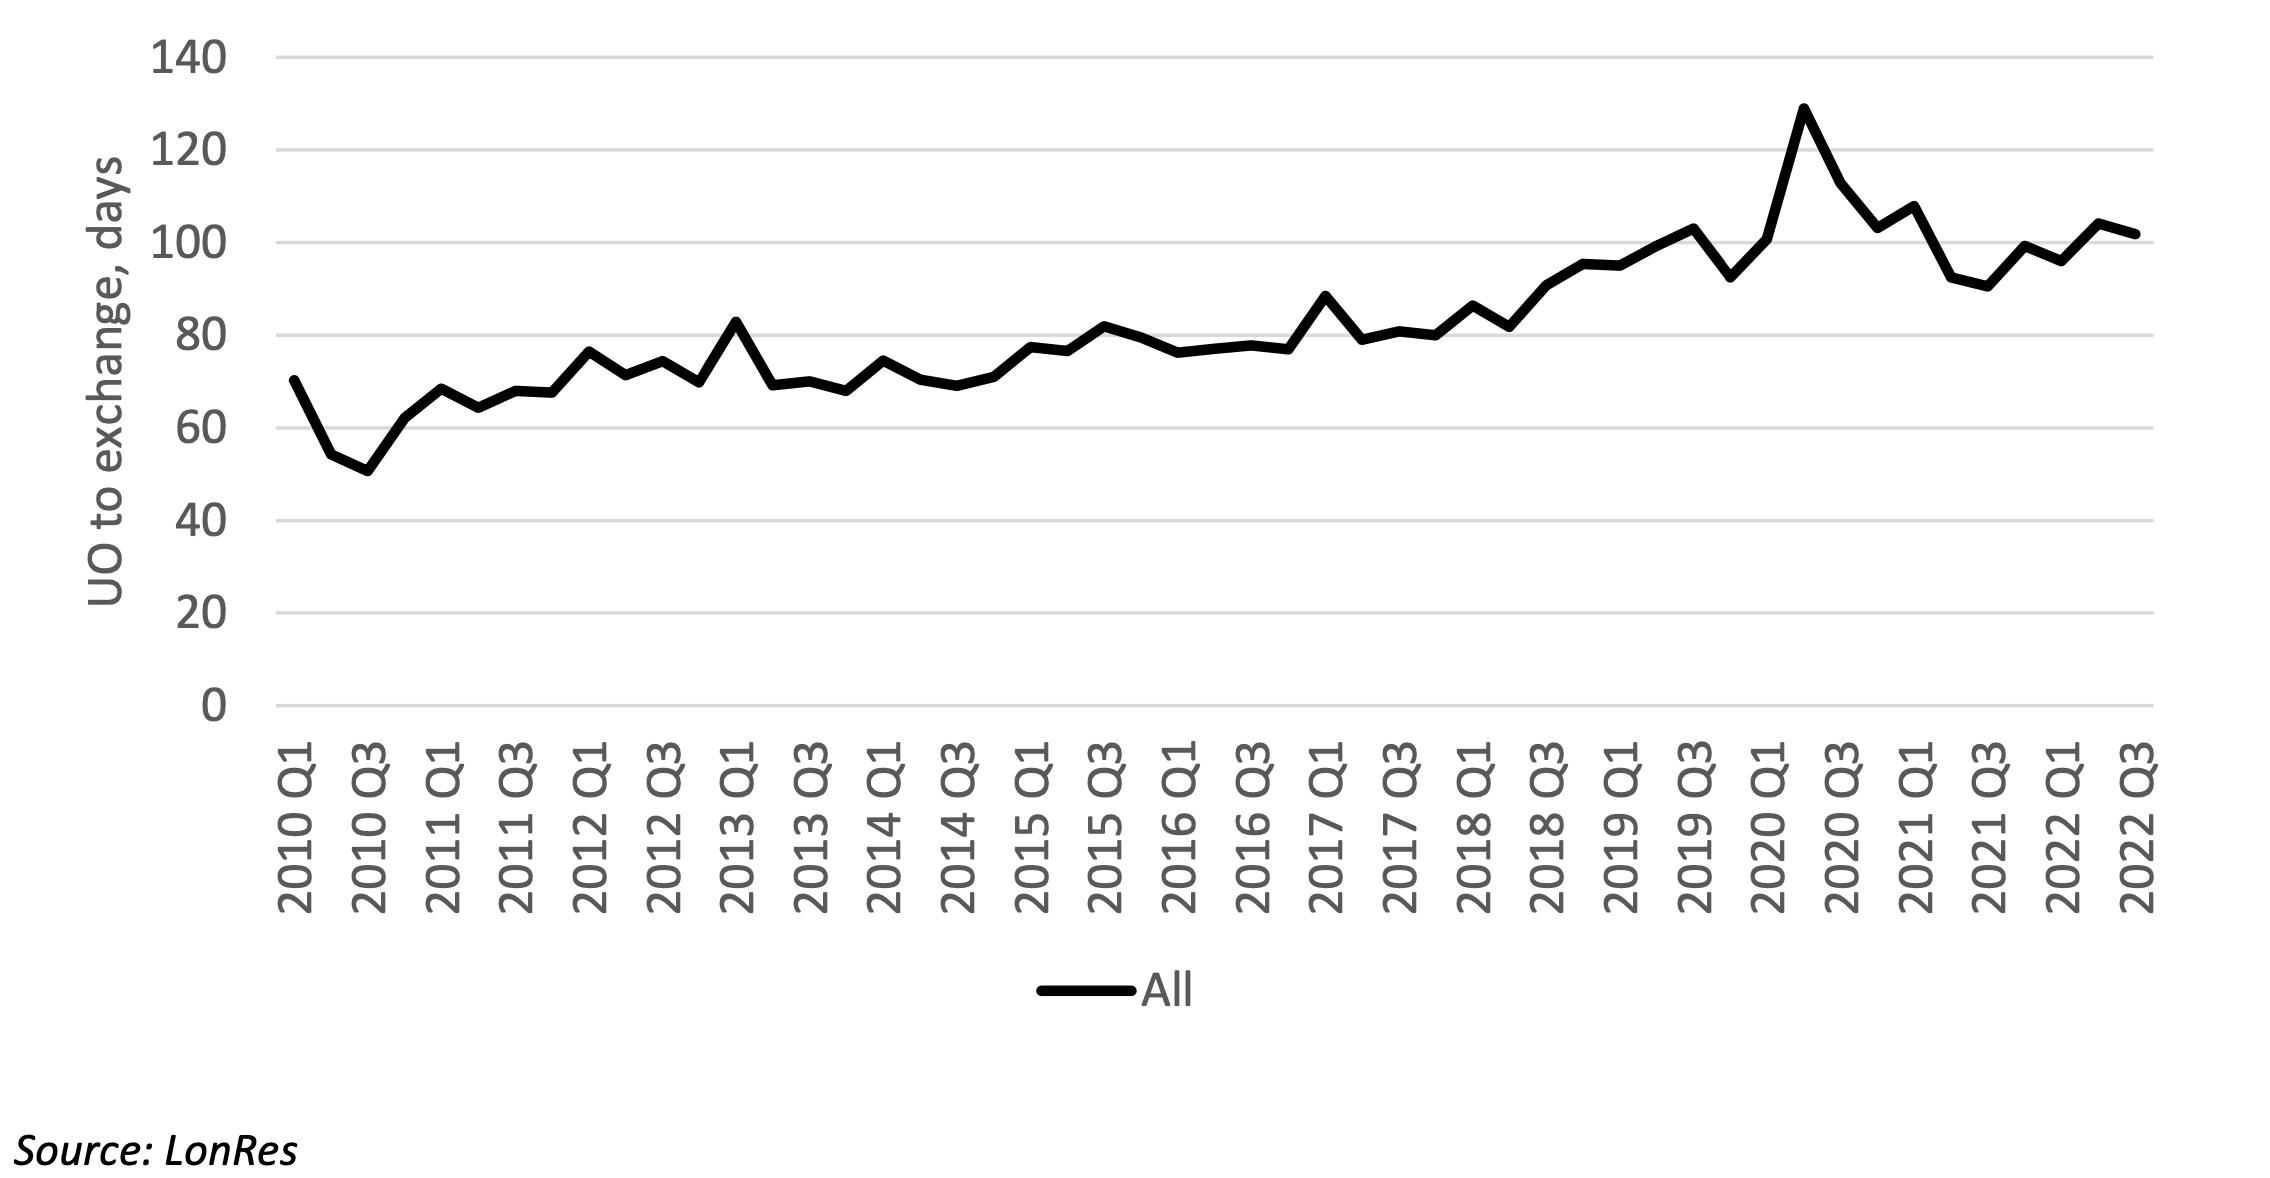
For all property types and values this measure is currently around 100 days across all three LonRes Prime London areas*. The figure for 2022 year to date of 100 is 19% higher than the 2015-19 average of 85. Overall

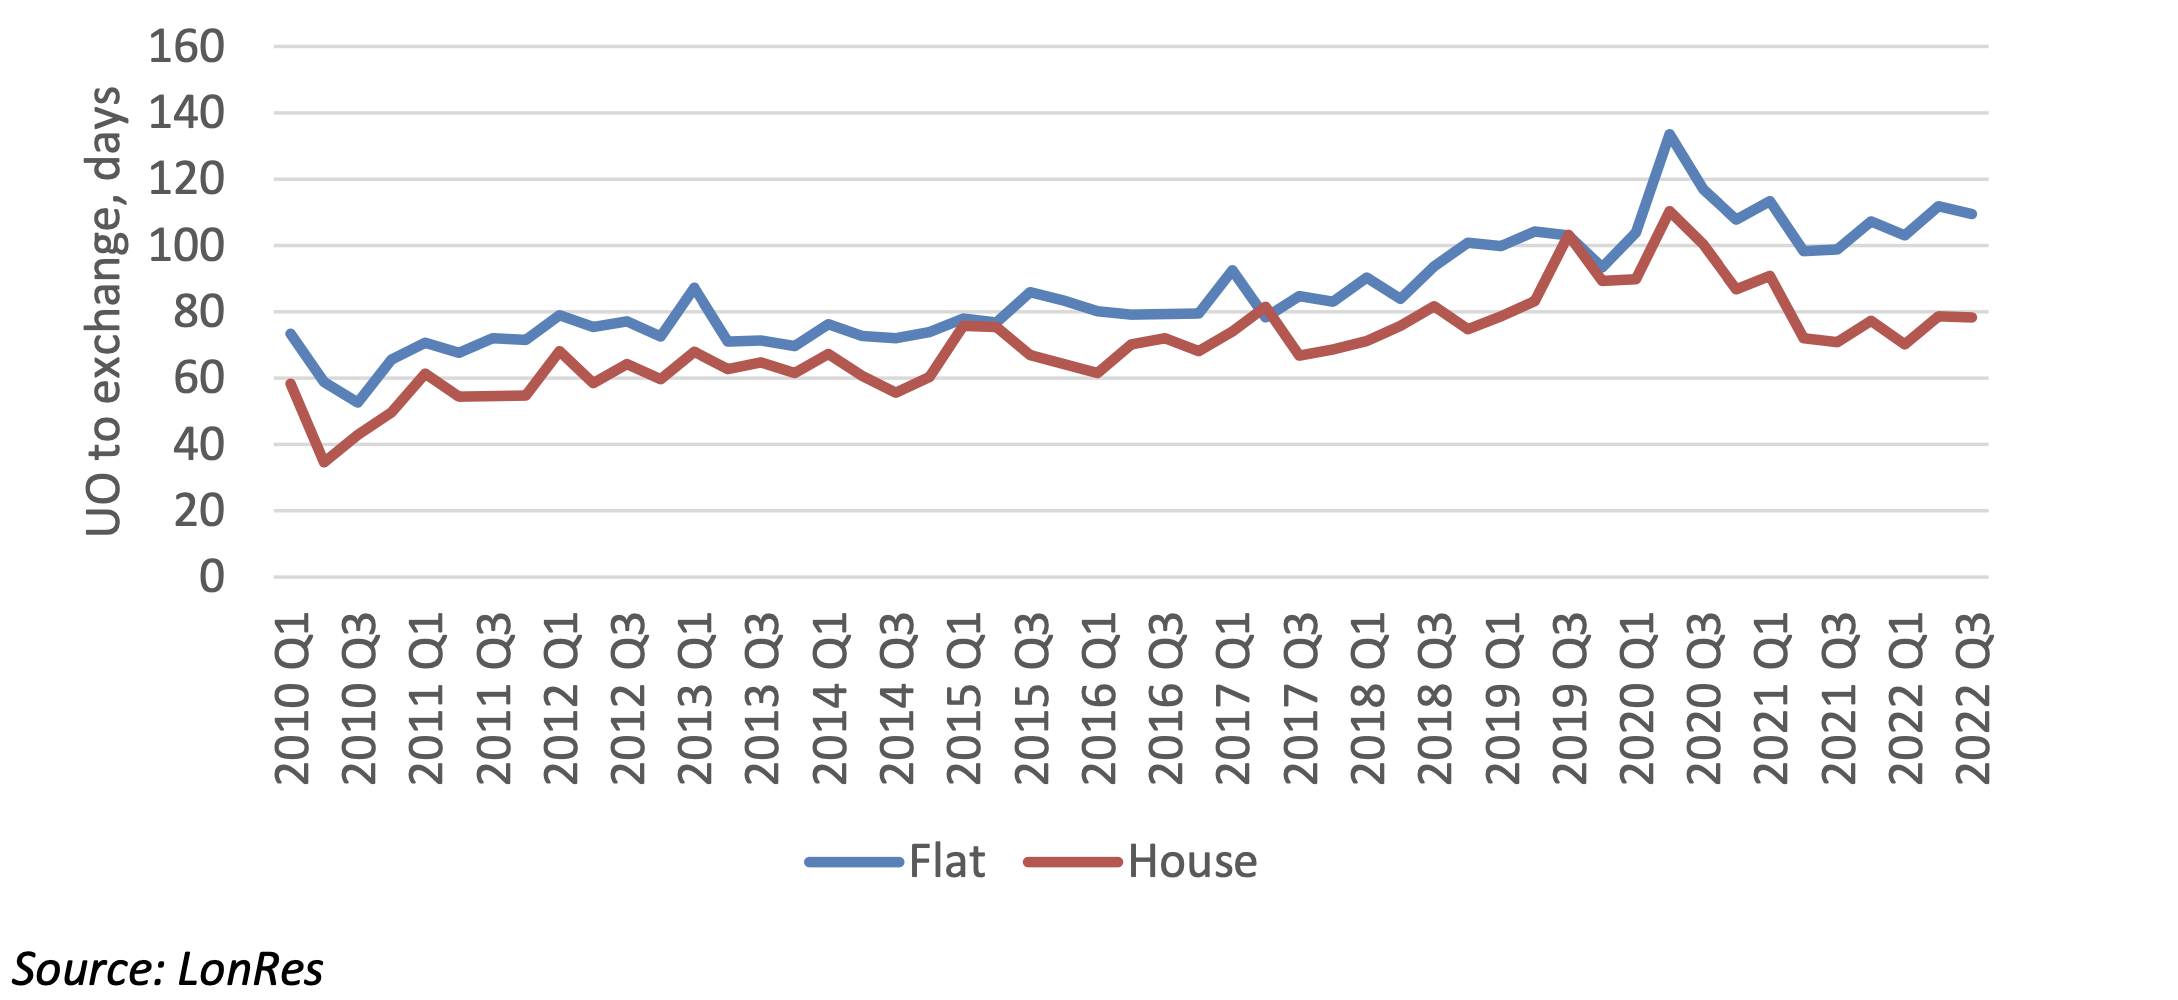
Flats take longer to sell than houses, and this has increased in the past three years. 2022YTD is 108 days for flats and 76 for houses, increases of 23% and 1% on the 2015-19 averages respectively. By property type

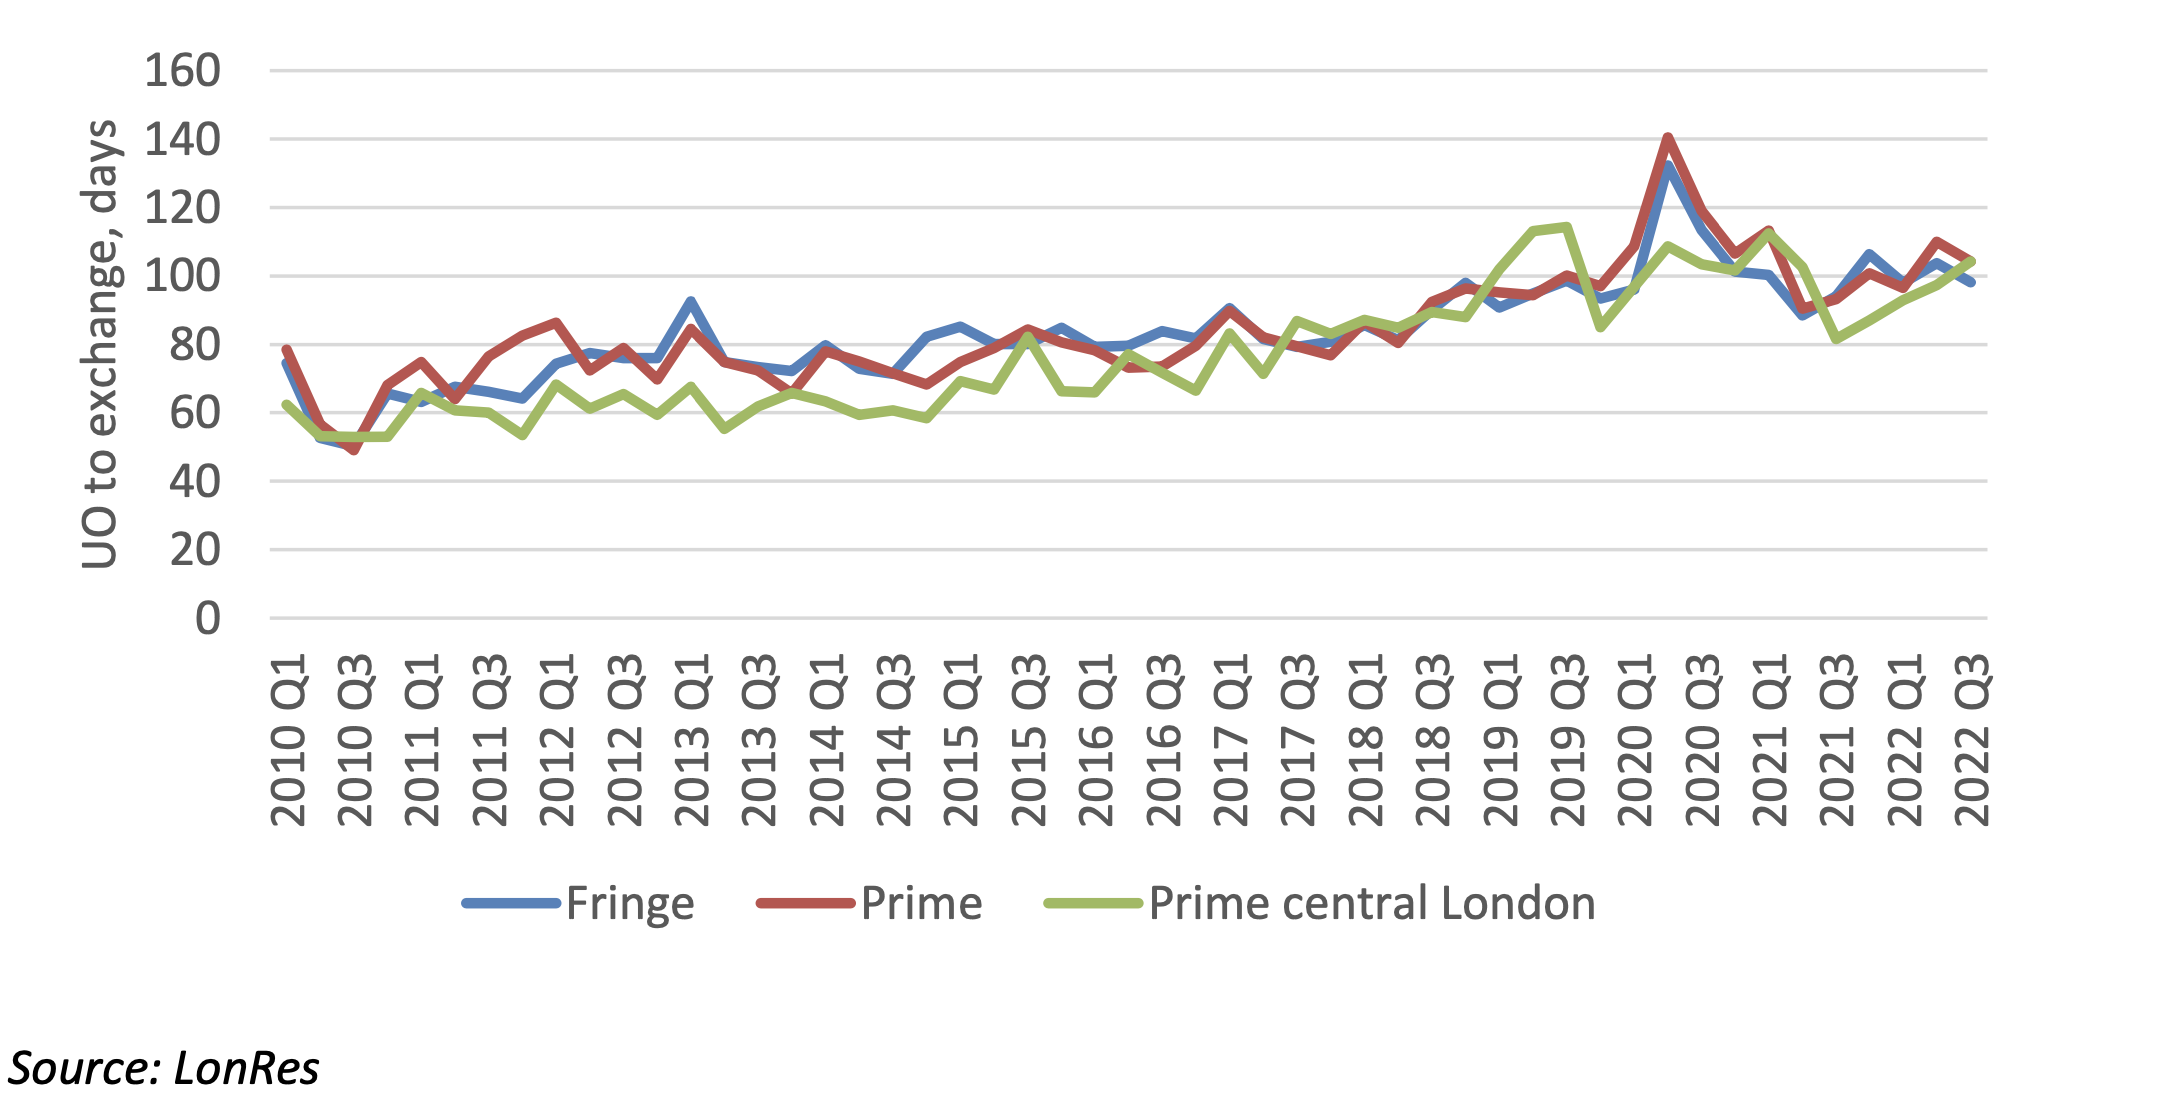
There is little variation by area: current (2022YTD) figures are 100 days for Fringe, 104 for Prime, and 97 for PCL. These are between 17 and 22% higher than the 2015-19 averages, in line with the overall trend. By area

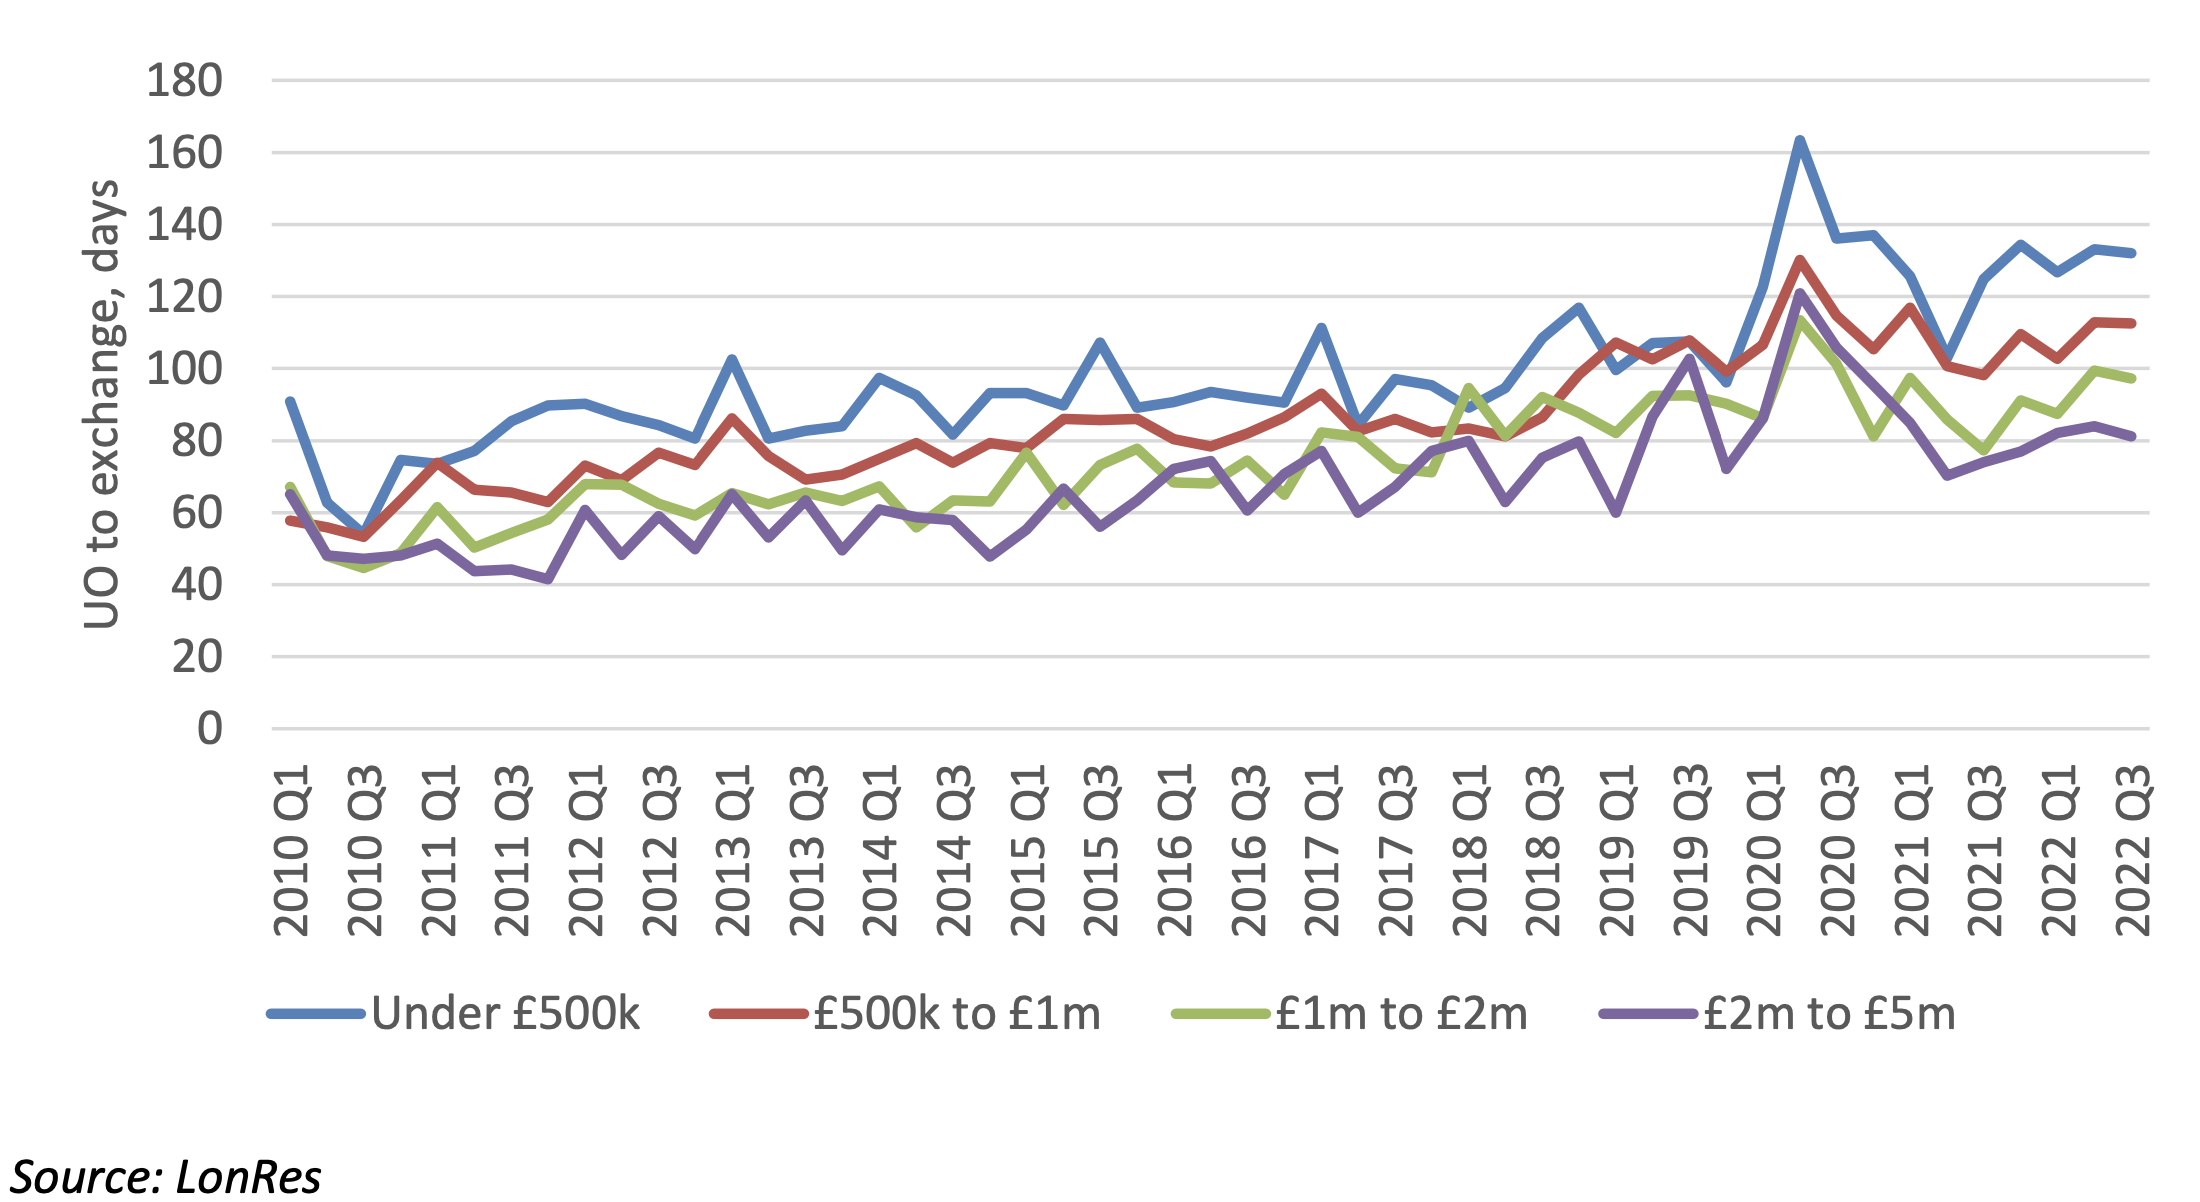
This chart indicates that higher value properties sell more quickly than cheaper ones. However, the higher bands comprise more houses while the lower ones are dominated by flats, so this is merely reflecting the trends mentioned above. By price

However, looking by price band and type, it does appear that the trend is genuine, with houses and flats in the highest value bands both selling more quickly than other bands and compared to their past performance. Note that the higher value bands are smaller markets and therefore the data is more volatile. By price band and type
For houses

For flats

*Prime London analysis includes properties within the following prime areas: Prime Central London: SW1Y, SW1X, SW1W, SW1A, SW3, SW7, SW10, W1S, W1K, W1J, W8. Prime London: NW1, NW3, NW8, SW1P, SW1V, W1T, W1H, W1U, W1G, W1W, W2, W11, W14. Prime Fringe: SE1, SE11, SW4, SW5, SW6, SW11, W4, W6, W9, W10.
Sign up to the Lonres newsletter