LonRes Charts: The Changing Face of the Top 1%
30 November 2021
The Changing Face of the Top 1% There’s been a subtle shift in the purchasing habits of prime central Londoners as buyers switch allegiance from Chelsea to St John’s Wood, from Knightsbridge to Notting Hill and from South Kensington to Marylebone.
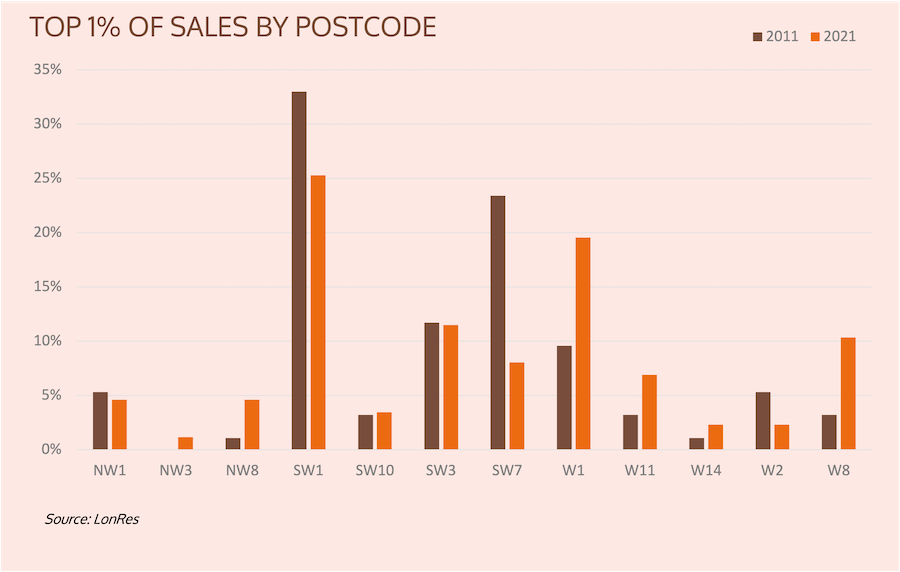
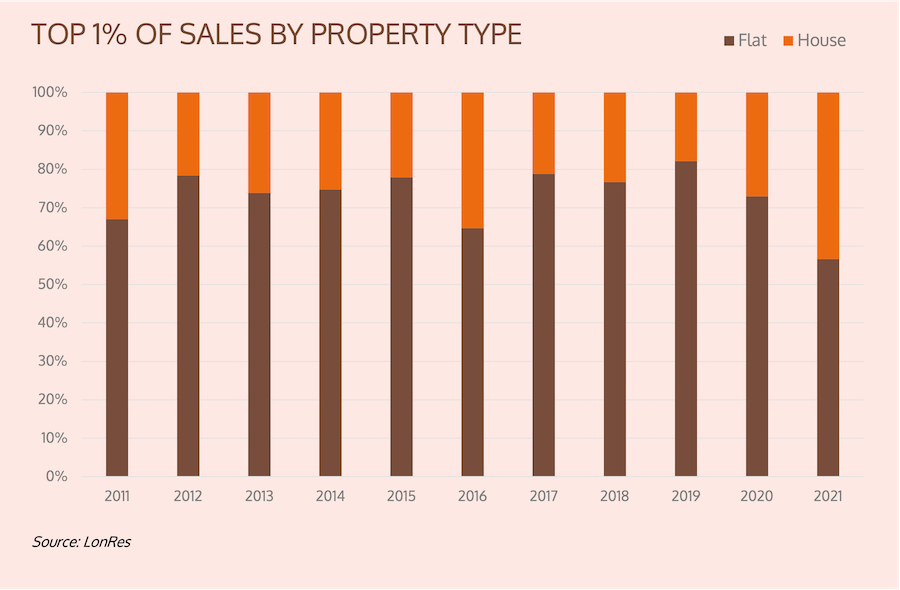
A decade ago the top 1% of sales were confined to just three postcodes. SW1 (Westminster, Knightsbridge, Belgravia), SW3 (Chelsea) and SW7 (South Kensington) was where the serious money was spent and the biggest deals done. LonRes analysis shows that in 2011 68% of sales in the top 1% were to be found in these SW postcodes; ten years on they account for less than half (45%). SW1 has seen the proportion of top end sales drop from 33% ten years ago to 25% this year. And in SW7 over the same period, the top 1% has fallen from 23% to just 8%. This is in sharp contrast to W1 which, driven largely by Marylebone, has seen the proportion of the top 1% of sales rise from 10% in 2011 to 20% so far this year. Kensington (W8), Notting Hill (W11) and St John’s Wood (NW8) have also seen their share of top 1% deals increase. As to how much these buyers are spending, the average spend of a top 1% purchaser is currently £3,154 per square foot. And to be included in the top 1% of sales, buyers had to spend at least £2,697 per square foot this year. And what are they spending their money on? Flats continue to account for the majority of the top 1% of sales. Yet the proportion of house sales has risen significantly this year. So far in 2021 flats accounted for 57% of sales, down from 67% a decade ago and a high of 82% in 2019. 43% of sales so far this year have been houses, the highest proportion of any year in the last decade. Covid has undoubtedly played a part in shaping London’s recent housing market. With overseas buyers restricted from travelling into the country, it’s domestic purchasers that have driven London’s super-prime areas. And for these wealthy buyers just now, it’s more about family homes in leafy suburbs, than flats with little or no outside space, in London’s most central districts.
*LonRes Prime London spans three core areas: Prime Central London takes in: SW1X, SW1W, SW1A, SW3, SW7, SW10, W1K, W1J, W8 If you would like to learn more, or use LonRes data in your own marketing, do get in touch
Prime London takes in: NW1, NW3, NW8, SW1P, SW1V, W1T, W1H, W1U, W1G, W1W, W2, W11, W14,
Prime Fringe includes: SE1, SE11, SW4, SW5, SW6, SW11, W4, W6, W9, W10
Sign up to the Lonres newsletter