Press release: Q4 2019 Prime Central London Analysis
20 January 2020
TRANSACTIONS UP 34% IN PRIME CENTRAL LONDON AS BUYERS RETURN TO MARKET Latest analysis of the prime central London housing market by independent property analysts, LonRes* Commenting on the analysis, Marcus Dixon, head of research at LonRes said: “In November when the December general election was called, there were fears that prospective buyers would put their move on hold until a result had been declared. Instead they chose to purchase and transaction volumes in prime central London (PCL) rose 34% over Q4 2019 compared with the same period a year earlier. “This was in contrast to the previous quarter (Q3 2019) when talk of changes to top end stamp duty rates resulted in fewer sales and buyers dragged out exchanges waiting for greater clarity. In the fourth quarter stamp duty appeared to drop off the political agenda and activity increased. Sales at £5 million or more increased by 78% on Q4 2018. This was the highest number of sales recorded in this price bracket for any quarter since Q4 2016. “Undoubtedly there were sales in Q4 that would have ordinarily gone through in Q3, yet comparing the second half of 2019 with 2018 still shows a 19% increase in sales volumes. “Alongside an increase in transactions, fewer properties came to the market this quarter. New instructions were down 2% on Q4 2018 and were 36% lower than five years ago. This means there are 19% fewer homes on the market now than there were a year ago. “Fewer properties, with sustained levels of demand helped push up average prices which increased by 2.4% across prime central London in Q4 2019 compared with the last three months of 2018. This represented the first annual increase for six quarters. “Some price brackets fared better than others. There were increases in achieved prices for homes between £2 million and £5 million but decreases below £2 million and above £5 million.” Prices Prices achieved in Q4 2019 were 2.4% higher than at the same point a year ago, the first annual increase since Q2 2018 (chart 1). Comparing prices in 2019 (full 12 months) with 2018 shows an annual fall of 3.8%. Chart 1: Annual change in achieved prices (£ per square foot)
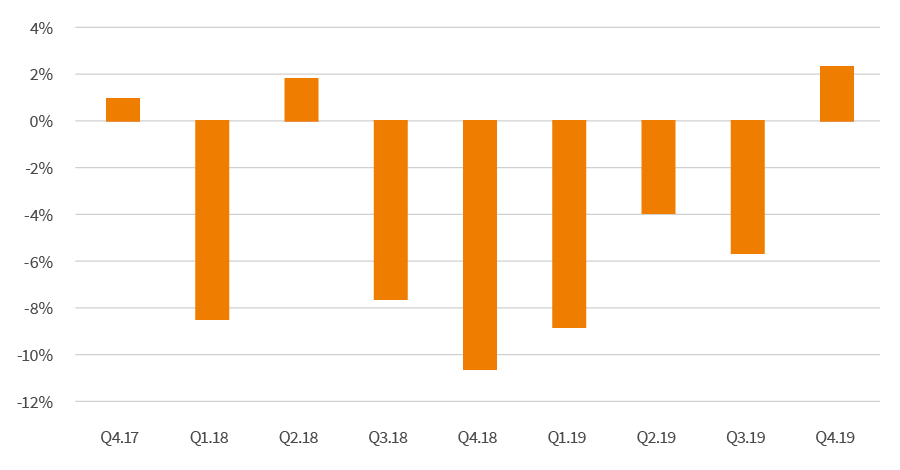
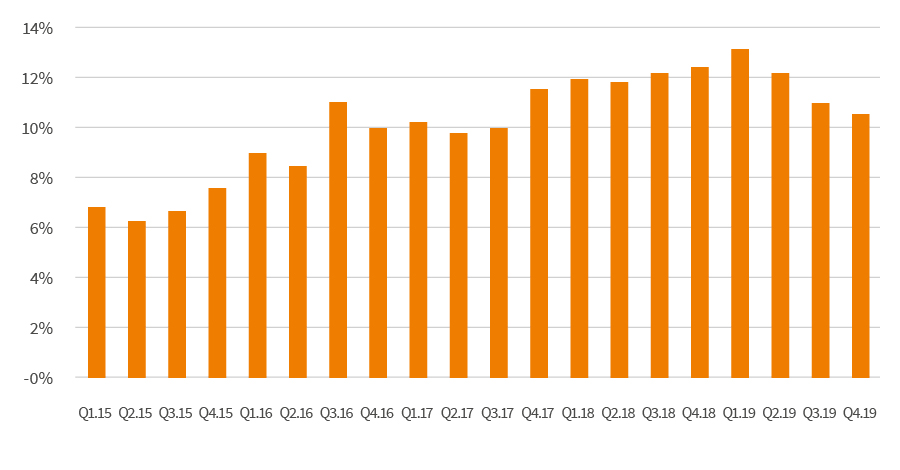
Source LonRes Transactions Transaction volumes in PCL rose again in Q4 2019, the third consecutive quarterly increase (compared to the same quarter a year earlier) with a 34% increase in the numbers of properties sold. Full year figures show transactions rose 15% in 2019 compared with 2018. Transaction changes by price bracket (tables 1 and 2) Under £2 million £2 million to £5 million £5 million+ Table 1: Transactions – annual change by price bracket Table 2: Prices – annual change by price bracket Discounts Average discounts on initial asking prices (the price at which a property was first listed) fell again in Q4 2019, with an average of 10.5% negotiated off initial asking prices. This meant average discounts were at their lowest level for two years (chart 2). Chart 2: Average discount achieved off initial asking price
The market under £2 million saw a 3.3% fall in achieved prices compared with the same period a year ago, but activity increased. The number of homes sold was up 20% compared with the same three months last year (Q4 2018).
There were 42% more sales in this price bracket in Q4 2019 compared with the same period a year ago. Prices rose by 3.2% compared with Q4 2018.
Activity levels in the £5 million+ market rose 78% in Q4 2019 compared with the same period a year ago, the highest increase of any price bracket in prime central London. This followed a slow third quarter, when volumes over £5 million fell by 33% on the same period a year earlier as buyers held off (due in part to potential changes to stamp duty rates mooted by government in the summer). An increase in activity was not matched by rising prices, with buyers paying on average 4.5% less per square foot than in Q4 2018.
Under £2m
£2m to £5m
£5m+
All
Q4 2019
19.7%
41.7%
78.1%
34.0%
2019 (full year)
22.6%
1.5%
17.2%
14.7%
Under £2m
£2m to £5m
£5m+
All
Q4 2019
-3.3%
3.2%
-4.5%
2.4%
2019 (full year)
-5.4%
0.0%
-1.7%
-3.8%
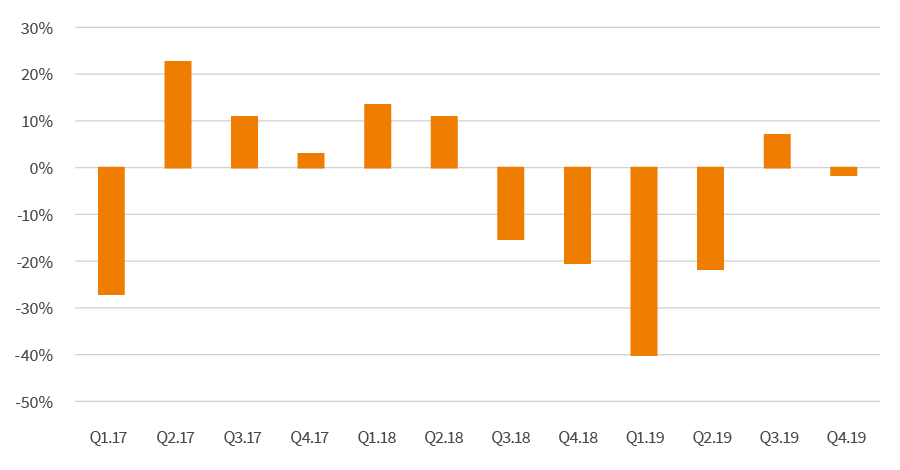
Source: LonRes New instructions In Q3 2019 new instructions in PCL rose for the first time since Q2 2018, with an 8% increase in the number of properties reaching the market for sale compared with the same period last year (chart 3). But in Q4 2019 new instructions fell again, down 2% on Q4 2018 (with Q4 2018 already 20% lower than Q4 2017). This coupled with an increase in sales means the number of available properties on the market is now 19% lower than at the same point a year ago. In 2019 (full year) the number of properties reaching the market for sale was down 17% on 2018 levels. Chart 3: Annual change in new instructions
Source: LonRes Prime Central London (PCL) includes all properties sold in the following postcodes: SW1A, SW1W, SW1X, SW1Y, SW3, SW7, SW10, W1J, W1K, W1S & W8. Ends *About LonRes An independent, privately-owned company, LonRes was established in 2000 as a subscription business-to-business data platform designed specifically to meet the needs of property professionals. Today some 6,000 residential property professionals working across prime London subscribe to what is widely regarded as the definitive database on the prime London sales and lettings market. LonRes tracks the prime London sales market in real-time, taking in sold prices and price movements - including price adjustments - and time on the market. LonRes has an unrivalled sales archive which dates back to 1979. LonRes lettings data, also in real-time, records – among other things - asking prices, price let and price adjustments. The LonRes lettings database dates back to 2004. LonRes has now extended its proposition beyond prime London to the country with its ResCountry service.
Sign up to the Lonres newsletter